Dashboard Overview
Your central hub for managing tripwires and monitoring detections.
Dashboard Layout
The dashboard provides a clear overview of all your tripwires and their current status. Here's what you'll find:
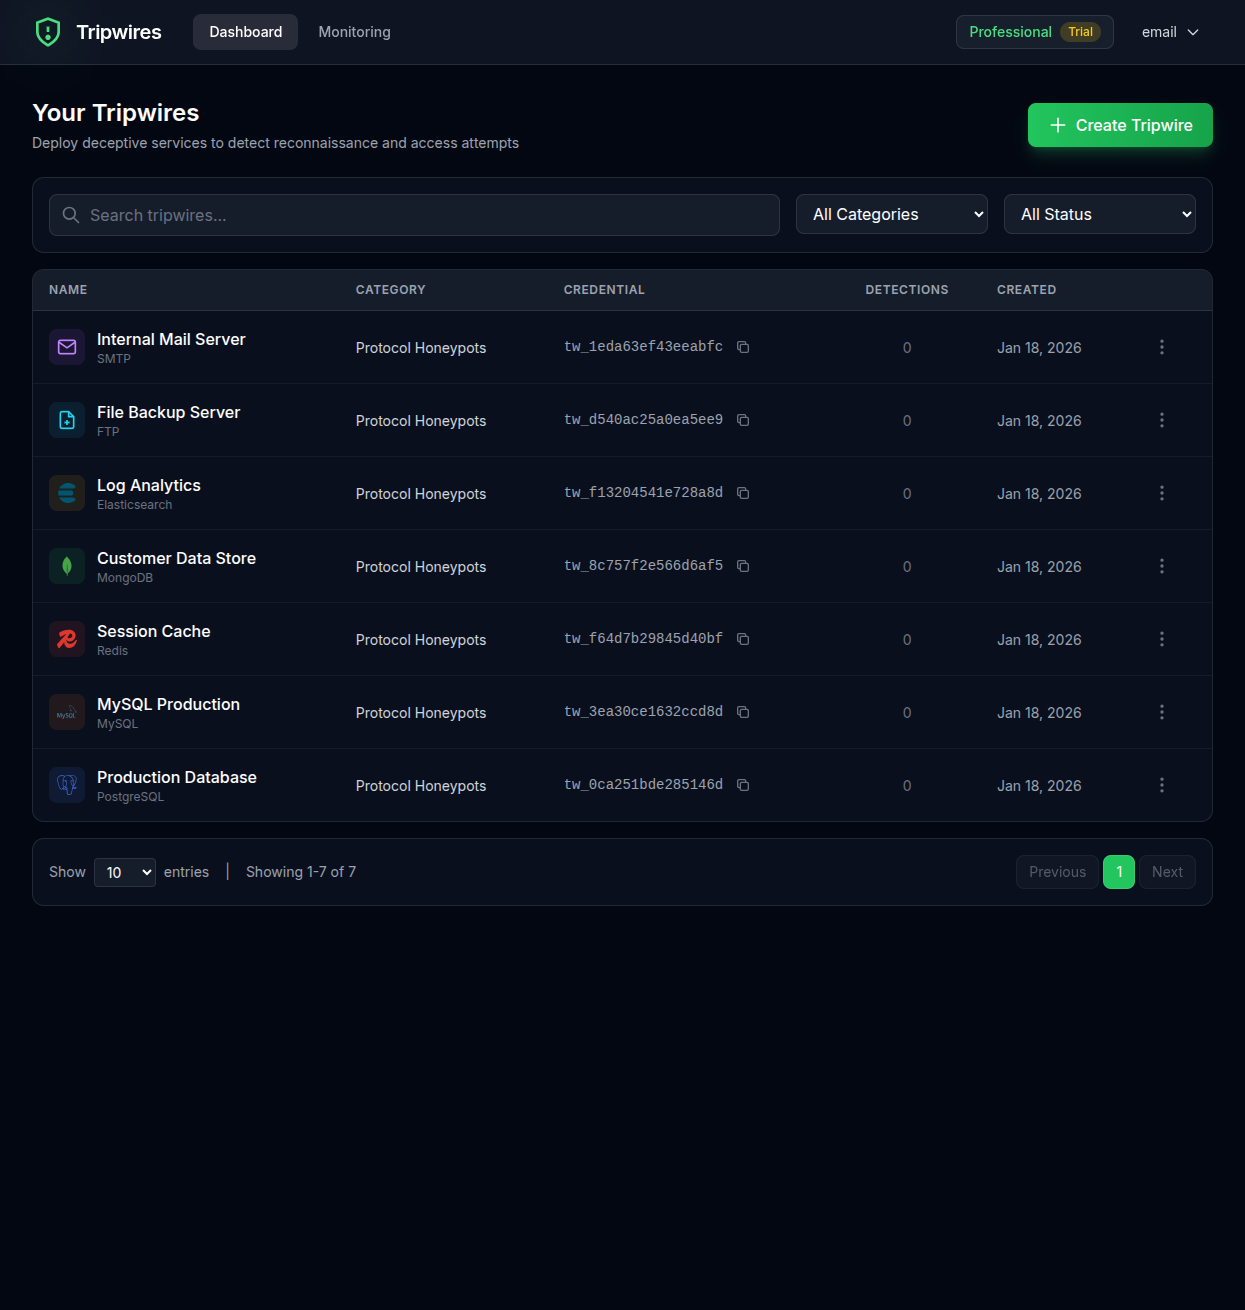
Tripwire List
View all your tripwires in a sortable table showing name, type, status, and detection count.
Quick Actions
Create new tripwires, access settings, and manage your account from the top navigation.
Status Indicators
Each tripwire shows its current state - active, triggered, or inactive.
Detection Counts
See at a glance how many times each tripwire has been triggered.
Tripwire Table
The main tripwire table displays the following information for each tripwire:
| Column | Description |
|---|---|
| Name | The descriptive name you gave the tripwire |
| Type | The tripwire type (e.g., PostgreSQL, MySQL, Redis) |
| Created | When the tripwire was created |
| Detections | Total number of times the tripwire has been triggered |
| Actions | Quick actions like view details, copy credentials, or delete |
Row Actions
Each tripwire row has a menu (three dots icon) with the following options:
- View Details - Open the full tripwire detail page
- Copy Credentials - Copy the connection string to clipboard
- Delete - Remove the tripwire (requires confirmation)
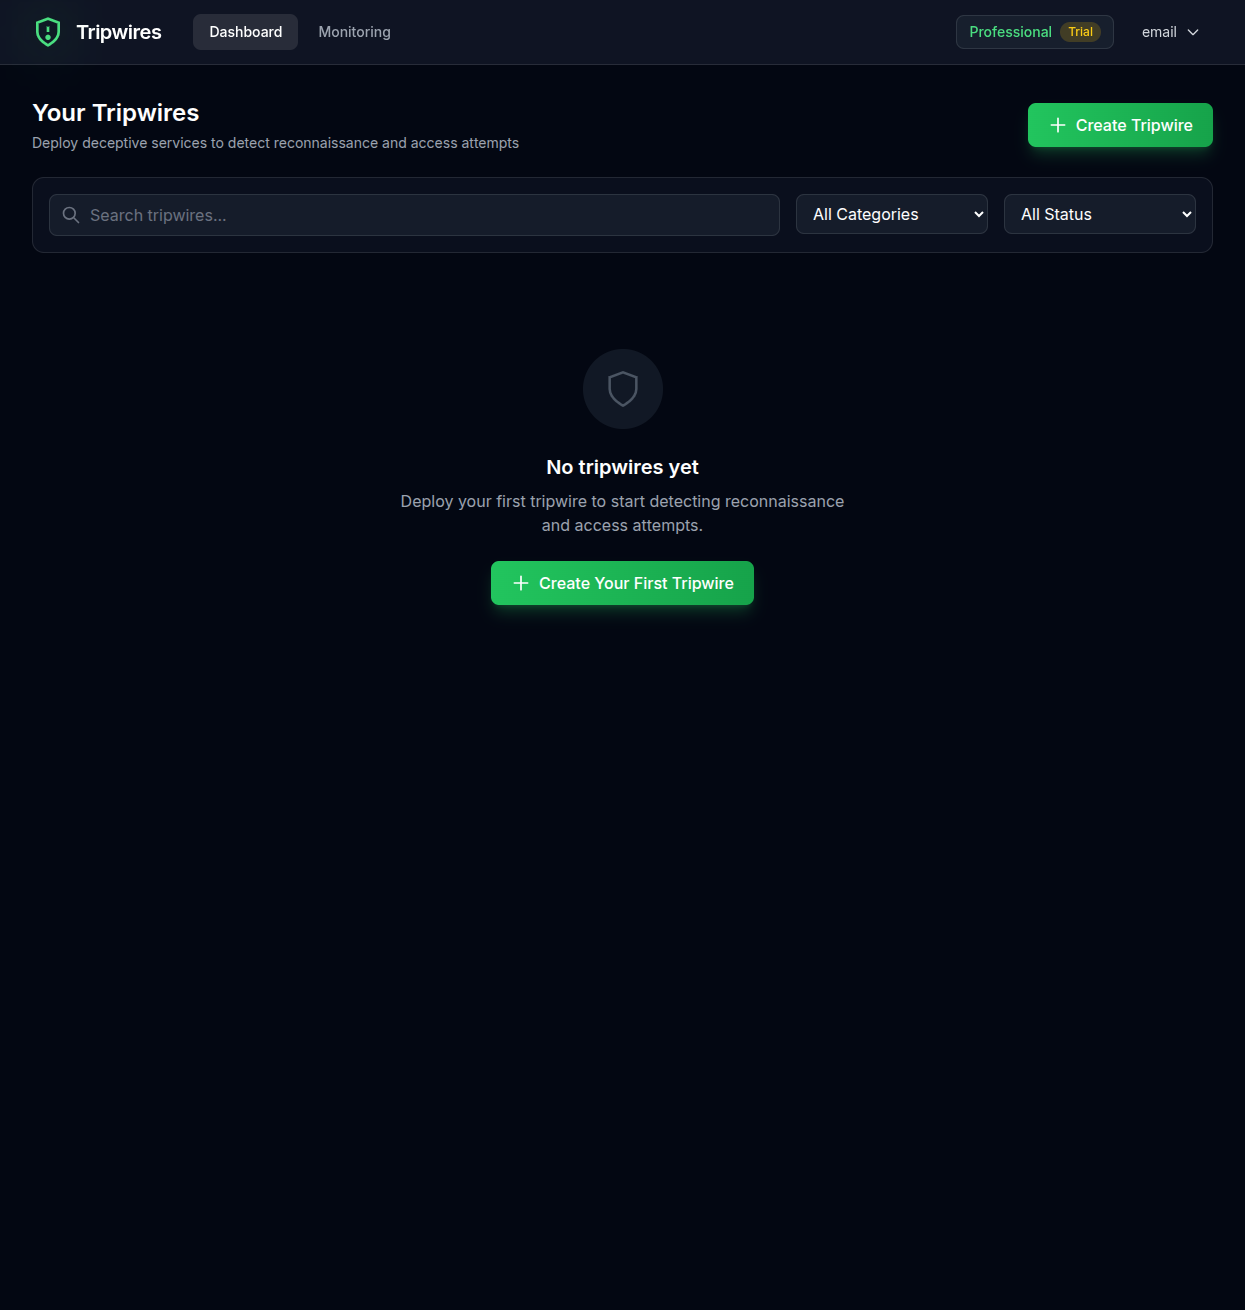
Empty State
When you first sign up or if you haven't created any tripwires yet, you'll see an empty state with a prompt to create your first tripwire.
Next Steps
Learn how to create new tripwires or explore the tripwire details page.